Ou Zhang

Ou Zhang

Research Scientist & Data Scientist

Pearson Psychometrics Service

Biography

I am a data scientist and psychometrician at Pearson. My research interests include psychometrics, applied statistics, data visualization, machine learning, and general data science. My current work mainly focuses on data science, psychometrics modeling, statistical analysis, testing development, and consulting.

I received my PhD in Educational Research, Evaluation, and Methodology from University of Florida in 2012.

Prior to joining Pearson Psychometrics Service, I was a Psychometrician II and team lead at clinical assessment branch in Pearson. While at clinical branch, I led multiple flagship clinical assessment products, including WISC-5, GFTA-3, KLPA-3, Quotient ADHD diagnosis test, TEACH-2 Behavior test.

Outside of psychometrics and data science, I am also a programming lover, a sports fan, and a father of two wonderful kids.

Interests

  • Psychometrics
  • Applied Statistics
  • Data Science
  • Machine Learning
  • Data Visualization

Education

  • PhD in Educational Research, Evaluation, and Methodology, 2012

    University of Florida

  • MEd in Educational Research, Measurement, and Evaluation, 2007

    Boston College

  • BSc in Computer Science, 2001

    Chengdu University of Technology

Experience


Data Scientist & Research Scientist

Pearson Psychometrics Service

Mar 2017 – Present San Antonio, Texas

Member of the Pearson psychometric team working across multiple projects including the NY Regents, The Partnership for Assessment of Readiness for College and Careers (PARCC), The Arizona English Language Learner Assessment (AZELLA), and National Board for Professional Teaching Standards (NBPTS), etc.

Responsibilities include:

  • Perform research program on psychometric modeling
  • Create and maintain SAS modules and R packages
  • Oversee development and execution of programming needs for scoring and reporting
  • Develop and maintain statistical methodologies for the psychometrics framework
  • Program and implement reproducible report system for multiple projects
  • Prepare research projects for presentation to national conferences and technical advisory committee


Psychometrician II & Team Lead

Pearson Clinical Assessment

Aug 2012 – Mar 2017 San Antonio, Texas

Lead psychometrician and team lead of the clinical assessment team working across multiple projects including the Wechsler Intelligence Scale for Children (WISC5), Test of Everyday Attention for Children (TEA-Ch2), and Pharmacy College Admission Test (PCAT)

Responsibilities include:

  • Designed and developed automated scoring and text mining algorithm and implemented to scoring module of digital assessment platform
  • Developed statistical model and scopes to examine the validity and reliability of the psychological/behavior measurement products
  • Evaluated and interpreted the statistical and psychometric analysis results for the internal stakeholders and research development
  • Authored technical documentations and statistical reports for the Pearson measurement projects
  • Motored and supervised psychometric teams including guiding psychometrician and statistical analysts in completing assignments and building up necessary statistical analysis and modeling techniques


Research Fellow & Statistical Consultant

Assessment and Program Evaluation Services, University of Florida

Nov 2008 – Aug 2012 Gainesville, Florida

Research assistant for the psychometric team working on the Collaborative Assessment & Program Evaluation Services.

Responsibilities include:

  • Worked with project director in the construction of evaluation plans and monitored evaluation process
  • Assisted in establishing, monitoring, evaluating, developing and implementing strategies for project evaluation
  • Designed and developed online survey instruments through qualtrics for NSF program evaluation
  • Compiled, cleaned, and analyzed quantitative/qualitative survey data for further analysis
  • Performed Portfolio Management campaign tracking and analysis
  • Developed& wrote summary reports of data analysis for multiple stakeholder audiencesand program staff
  • Created R scripts to score technology enhanced items

Projects

*

Quotient ADHD Diagnosis System

Quotient ADHD Diagnosis System

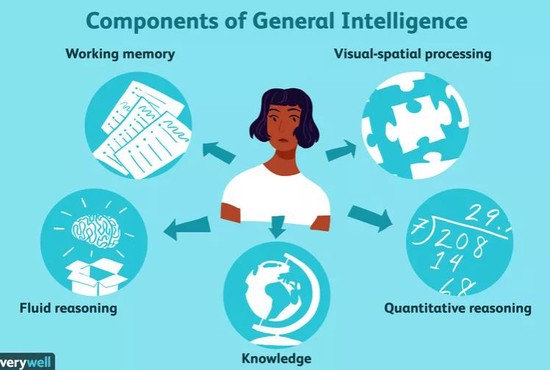
General Intelligence G-loading

General Intelligence G-loading

Recent Posts

9 Join Function Example with the R {dplyr} Package

1 Simple Example Data 2 Load {dplyr} package 3 Function 1: inner_join 4 Function 2: left_join 5 Function 3: right_join 6 Function 4: full_join 7 Function 5: semi_join 8 Function 6: anti_join 9 Complex Example 1: Join Multiple Data Frames 10 Complex example 2: Join by Multiple Columns 11 Complex example 3: Join Data & Delete ID I always wanted to write a blog post summarizing the join function.

Outliers-Part 4:Finding Outliers in a multivariated way

1 Data Source 1.1 Variables in Data 2 Model-specific methods 2.1 Cook’s Distance 2.2 Pareto 3 Multivariate methods 3.1 Mahalanobis Distance 3.1.1 Details about Mahalanobis Distance 3.2 Robust Mahalanobis Distance 3.3 Minimum Covariance Determinant (MCD) 3.3.1 robust tolerance ellipsoid (RTE) 3.4 Invariant Coordinate Selection (ICS) 3.5 OPTICS 3.6 Isolation Forest 3.7 Local Outlier Factor 4 ‘check_outliers’ function in {performance} R package 4.0.1 Threshold specification 5 Reference Figure 0.

Outliers-Part 3:Outliers in Regression

1 Types of Unusual Observations 1.1 Regression Outliers 1.2 Leverage 1.3 Influential Observations 1.4 Good vs. Bad Leverage 2 Detecting Influential Observations 2.1 Graphic diagnostics 2.1.1 A scatter plot with Confidence Ellipse 2.1.2 Quantile Comparison Plots (QQ-Plot) 2.1.2.1 Rule of Thumb 2.1.3 Added-variable plots 2.2 Numerical diagnostics 2.2.1 Hat Matrix 2.2.1.1 Rule of Thumb 2.2.2 Standardized Residuals 2.2.2.1 Rule of Thumb 2.2.3 Studentized Residuals 2.

Outliers-Part 2:Finding Outliers in a univariated way

1 Method 1: Sorting Your Datasheet to Find Outliers 2 Method 2: Graphing Your Data to Identify Outliers 2.1 Histogram 2.2 Boxplot 2.2.1 Adjusted boxplot (Hubert and Vandervieren, 2008) 3 Method 3: Using Z-scores to Detect Outliers 3.1 Z-Score pros: 3.2 Z-Score cons: 4 Method 4: Using the Interquartile Range (IRQ) to Create Outlier Fences 5 Method 5: Percentiles 5.1 scores function from {outliers} packages 6 Method 6: Hampel filter 7 Method 7: Finding Outliers with Hypothesis Tests 7.

Outliers-Part 1:Causes, Philosophy and General Rules

1 What are Outliers? 2 Causes for Outliers 3 Types of Outliers 4 Philosophy about Finding Outliers 5 General Rules Figure 0.1: Outliers 4 years ago (Yes, back to 2016), I was asked by a director of data science department from a very famous IT company about outliers. Basically, she asked two questions: What are outliers? How to detect them? Also in my daily research life, I have encountered noisy data all the time.

Recent & Upcoming Talks

VBA and DDE automated way to populate table into formatted Excel

VBA + DDE: automated way to populate table into formatted Excel

Write Readable Code

Write readable code: Simple and Practical Techniques for Better Statistical Programming.

Measurement Invariance-A Theoretical Framework in CFA

A brief introduction of the measurement invariance theory framework

Multi-dimensional Item Response Theory

A brief introduction of the Multi-dimensional Item Response Theory

R & RStudio Introduction

A brief introduction of the R and RStudio

Resources

*

RStudio Conference 2019 Notes at Austin

A RStudio Conference 2019 Notes at Austin

Outlier Detection

Outlier Detection tutorial and codes

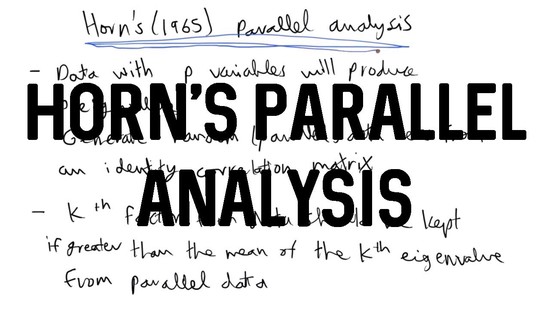
Parallel Analysis

Parallel Analysis tutorial and codes

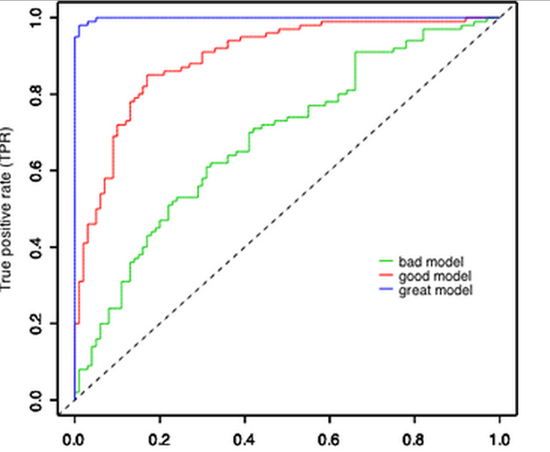
Logistic Regression and ROC in SAS

Logistic Regression and ROC in SAS